 RMON
RMON
- How to get licence
- How to set up your Time zone
- How to create a Telegram bot and use it with RMON
- How to create a Slack APP and use it with RMON
- How to create PagerDuty Integration key and use it with RMON
- Notifications and alerting
- Status pages
- Security checklist
- How to use groups and roles
- How to change user settings
Servers
Dashboard and check groups
Open Dashboard to review monitoring checks in the active group. Use a check's name to open its detailed results and charts. For installation resource use and service status, open Overview.
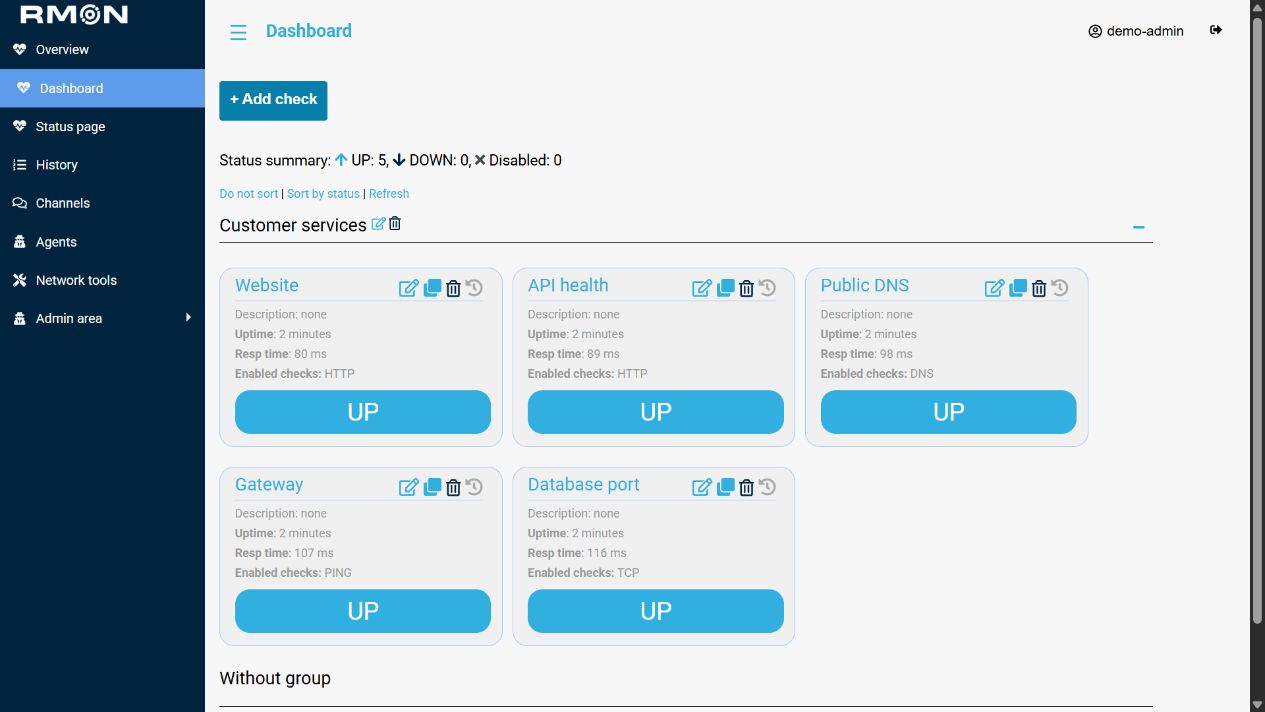
Read the status summary
The summary groups checks into UP, DOWN and Disabled. UP counts enabled checks with a successful state; DOWN includes enabled checks whose state is not UP, including warning and unknown states. Disabled checks are counted separately. Open a card for its specific state and compare its reporting locations before judging the scope of an incident.
Read a check card
Scroll horizontally to view the full table.
| Field | How to use it |
|---|---|
| Name and description | Identify the monitored service. Open the name for measurements, charts and results from each location. |
| State | Read the text: UP, DOWN, HTTP failure, body failure, warning, unknown or disabled. Use the detailed result to find the reported cause. |
| Uptime / downtime | Time since the recorded state change. This is different from the timestamp of the latest measurement. |
| Response time | Reported response time in milliseconds. For a failed check the card can show its last response time; N/A means no value is available for display. |
| Check type | The protocol or service the check tests, such as HTTP, DNS, TCP, Ping, SMTP or RabbitMQ. |
Confirm that results are arriving with new timestamps. A saved or older UP state is not proof that an agent is still reporting. Use reading results and history to investigate a warning, a failure at one location or a gap in measurements.
Organize checks into groups
A check group is a Dashboard category, for example Customer website or Mail services. It helps organize checks within the current workspace. User groups and roles separately determine access.
- Create or edit a check and open the wizard's Notifications step.
- In Group, select an existing name from the suggestions or enter a new name. Saving a new group name creates that category.
- Save the check and return to Dashboard. Checks with no category appear under Without group.
Use a group heading's + and − controls to show or hide its cards. The browser remembers which groups you have expanded. Collapsing a group only changes the display; its checks continue to run.
Editors and administrators can rename a category using its edit action. Deleting a check group removes the category and leaves its checks without a group. To move one check, edit that check's Group field. To remove monitoring itself, use the check's own disable or delete action.
Sort and refresh the view
Sort by status arranges cards by their status categories and removes the group headings from that view. Use Do not sort to return to the grouped layout. This changes the display, not the saved group assignment.
Cards refresh at their check intervals. Use Refresh to reload the page after changes. Refreshing Dashboard does not force an agent to perform a new measurement; wait for the next scheduled result.
Choose a check action
- + Add check opens the check wizard.
- Edit changes the target, locations, conditions and notifications. Reopen the check after saving to verify the settings and a fresh result.
- Clone opens a copy for creating a separate check. Give it a distinct name and review its locations and notification destinations before saving.
- History opens the check's incidents and status changes. The check name opens the measurements and charts.
- Delete removes the check from monitoring. For a temporary pause, edit the check and clear Enable so you can use it again later.
Managing checks requires editor or administrator access in the active group. If you cannot make a change, check your current group and role. If Dashboard has no checks, use the first-check example; if it reports a stopped RMON service, ask the administrator to check the receiver and service logs.