By clicking on the name of the check, you can see the statistics received by the agent. The results are displayed in the time zone you selected in the account settings.
For each check type, the agent collects and displays your service's current response time, average response time per 24 hours, uptime per 24 hours and the number of days the certificate has been expired.
For HTTP(s) checks, the agent also displays the following data on the graph:
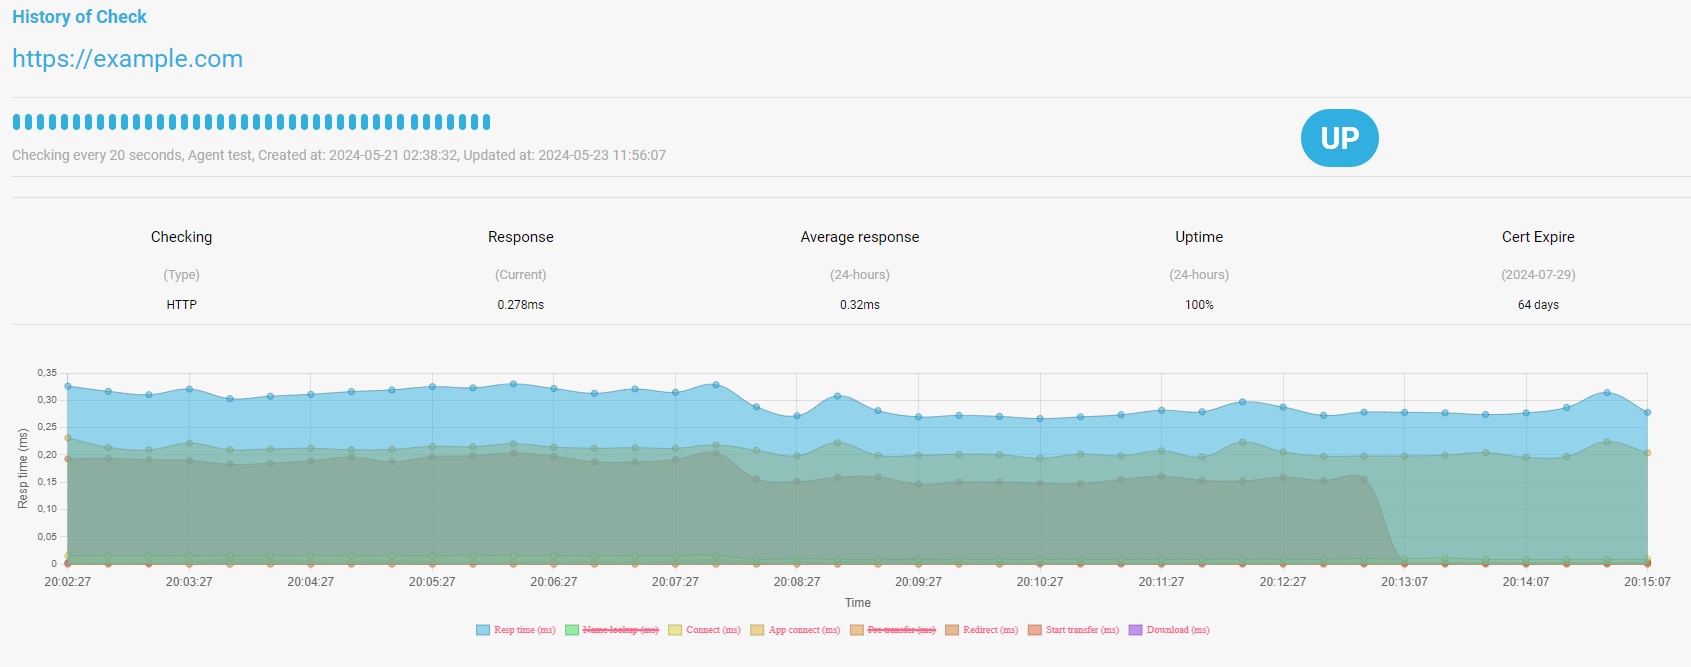
To exclude some results from the graph, click on the corresponding legend items.