How to keep metrics in VictoriaMetrics
How to keep metrics in VictoriaMetrics
About VictoriaMetrics
VictoriaMetrics is an open-source time series database that's great for storing and processing lots of time-stamped data. It's especially useful for monitoring applications, infrastructure, and business metrics.
VictoriaMetrics is optimized for high performance, allowing it to ingest and query large datasets with minimal latency. Additionally, it provides easy integration with a simple API and supports various data ingestion methods, making it convenient to connect with other systems and tools, including RMON, in your monitoring stack.
VictoriaMetrics can collect a wide range of metrics that are essential for monitoring systems, applications, and business processes. Some of the key types of metrics include:
- Server Status — provides health checks and status updates for servers.
- CPU Usage — tracks the percentage of CPU resources being utilized.
- Network Traffic — analyzes the amount of data being transmitted and received over the network.
- Response Time — measures the time taken to respond to user requests.
- Request Count — counts the number of requests received by an application or service.
- Error Rates — monitors the frequency of errors occurring in applications.
- Latency — measures the delay experienced in processing requests.
For more detailed information on installation, configuration, and usage, refer to the official VictoriaMetrics documentation.
Using VictoriaMetrics with RMON
Since version 1.2.4, RMON supports storing Checks metrics in VictoriaMetrics.
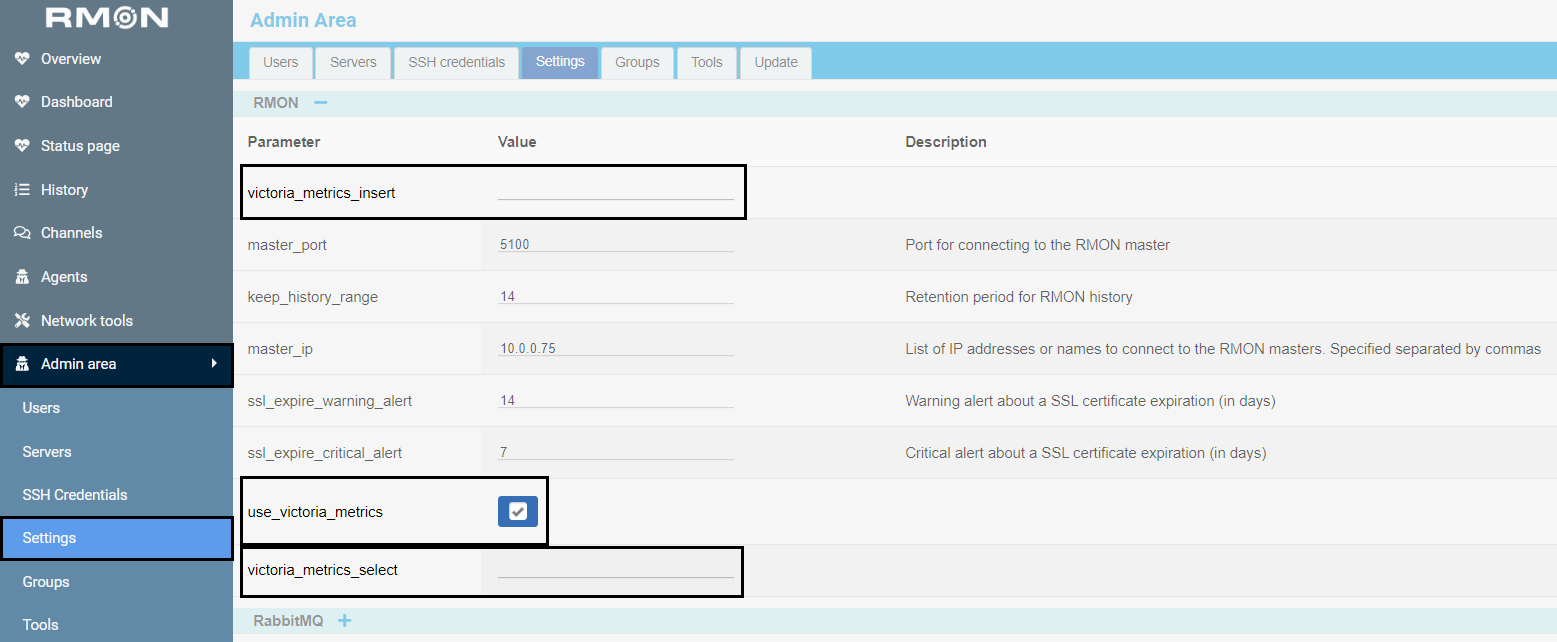
The feature is disabled by default. To enable it, go to the Admin area => Settings => RMON section and check the use_victoria_metrics box.
Next, enter the link in the victoria_metrics_insert field which will be used to collect metrics from Checks and send them to VictoriaMetrics. Additionally, enter the link in the victoria_metrics_select field whick will be used to retrieve data from VictoriaMetrics and display it in RMON.
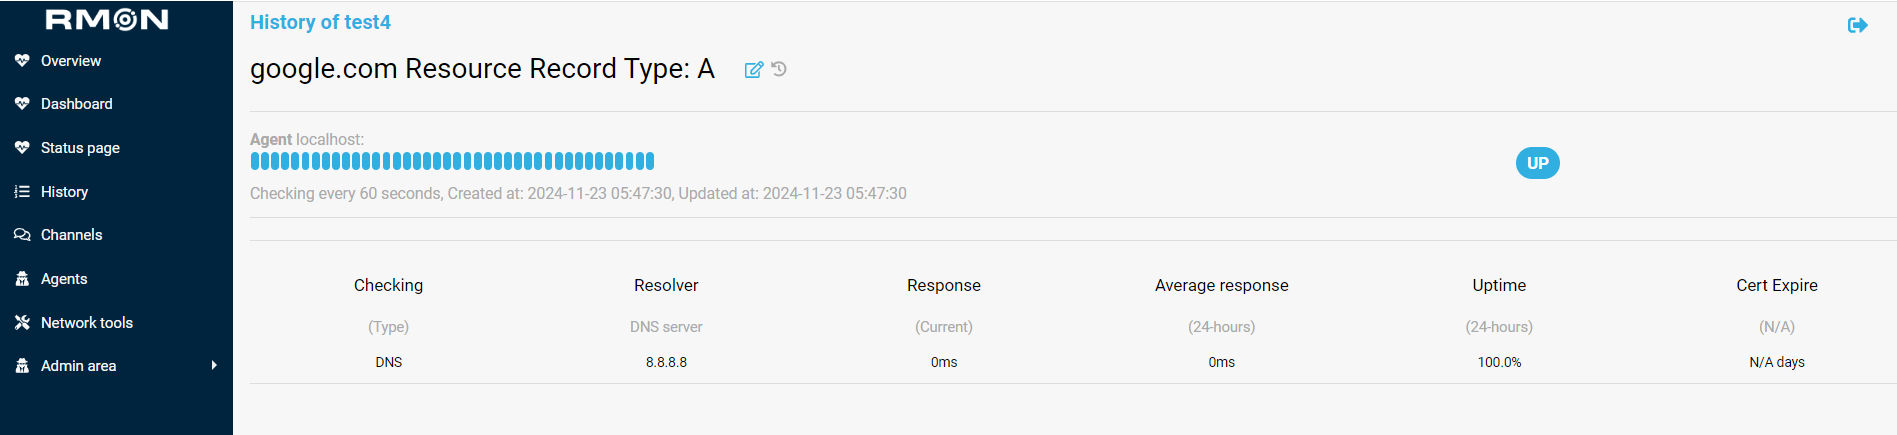
After this, VictoriaMetrics will collect metrics from all existing and newly created Checks.
To view the metrics, go to the Dashboard section and click on the name of the desired Check.