 RMON
RMON
- How to set up your Time zone
- How to create a Telegram bot and use it with RMON
- How to create a Slack APP and use it with RMON
- How to create PagerDuty Integration key and use it with RMON
- Notifications and alerting
- Status pages
- Security checklist
- Company sign-in with OIDC
- Get started with the RMON API
- Backup and recovery
- How to use groups and roles
- How to change user settings
Servers
Agents
Monitoring locations
An RMON agent performs assigned checks and sends their results to RMON. Place agents in offices, data centers or cloud regions to measure availability from those networks. One agent can run many checks; one host can have one RMON agent.
Add and configure
Register the host under Admin area → Servers, verify SSH access, and use Agents → Add Agent. Select its result delivery mode during installation. Manage agents covers installation, group certificate settings, HTTPS, mTLS and reconfiguration.
Manage agents
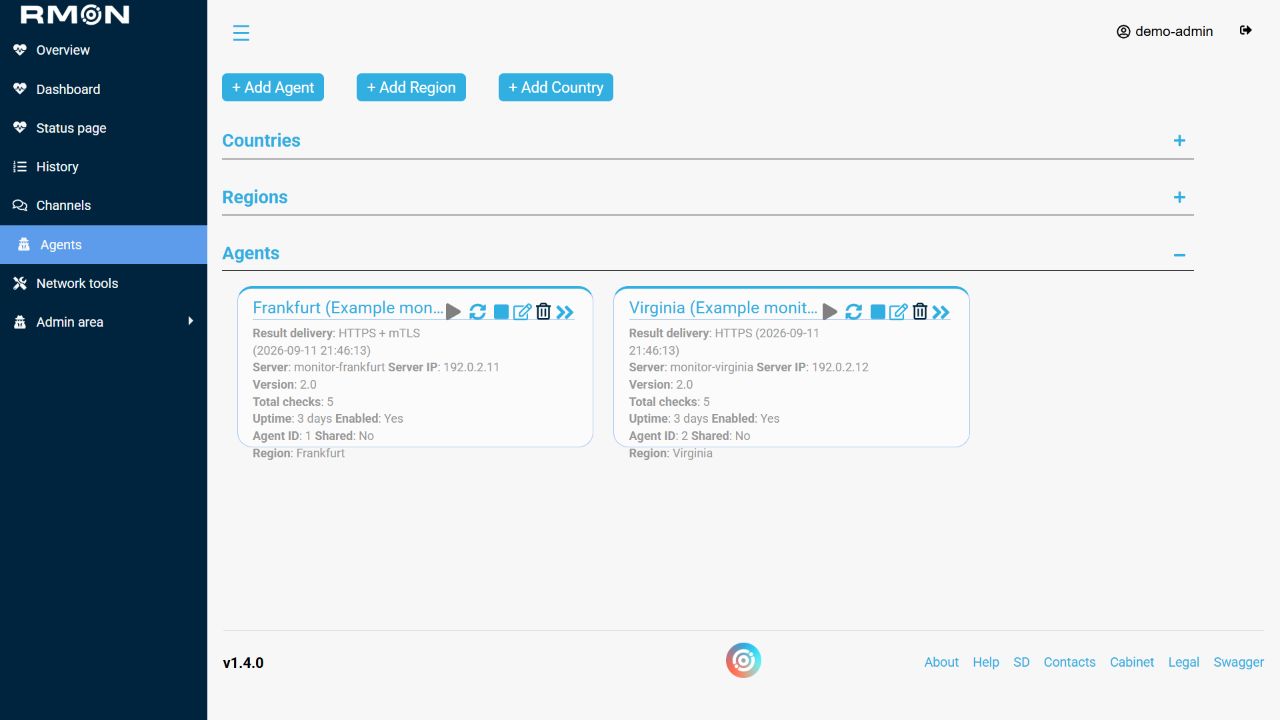
The card shows the host, version, enabled and shared state, region and last applied result delivery mode. Open the agent's name for its checks. Available actions depend on your role and the agent's owner group. Guest users do not have the agent management menu.
Read the agent card
Scroll horizontally to view the full table.
| Field or state | Meaning and next action |
|---|---|
| Enabled | The agent's saved availability setting. Check the running state and latest result times as well when confirming that it is performing checks. |
| Running / paused / unavailable | The card's status comes from the agent management connection. A running response shows the service is active; a paused state means it reports that it is stopped. An unavailable status means RMON could not obtain a valid response. Check connectivity before deciding to reinstall. |
| Total checks and Uptime | Values reported by the agent. A dash means the value could not be obtained; verify the connection and refresh the page. |
| Result delivery | The last successfully applied mode: HTTP, HTTPS or HTTPS + mTLS. The displayed verification time records that application and verification; use fresh check results to confirm ongoing delivery. |
| Not yet verified | No verified delivery mode has been recorded. Select the intended mode and successfully Reconfigure the agent to establish it. |
| Changes pending application | Saved connection settings differ from the last applied settings. Complete Reconfigure and review its final task status. |
| Shared and Region | Sharing makes the agent available beyond its owning group; its region organizes check assignment. The agent continues to use its owner's connection settings. |
Successful access to the management connection does not verify delivery to the result receiver. Open an assigned check and confirm that its result time advances. Use agent troubleshooting when new measurements stop arriving.
Choose an action
- Start, Stop and Restart control the service. Editors and administrators can use these actions for agents they are permitted to manage.
- Edit and Reconfigure let an administrator apply connection settings and the selected agent version. Restart alone does not apply saved connection changes. Follow applying settings to an existing agent.
- Transfer checks moves an agent's workload to another agent. Follow replacing an agent and transferring checks, and verify new results before deleting the old agent.
Choose where checks run
In the check wizard, use Run checks from → Agents and move the desired agents into Selected. You can also select countries or regions. See locations and creating checks.
Compare results
Review each selected location in the check details. A failure at one location may indicate a local network problem; failures at several locations help identify a wider incident. See reading results.
For a separate receiver, use the RMON Server deployment guide.