 RMON
RMON
- How to set up your Time zone
- How to create a Telegram bot and use it with RMON
- How to create a Slack APP and use it with RMON
- How to create PagerDuty Integration key and use it with RMON
- Notifications and alerting
- Status pages
- Security checklist
- Company sign-in with OIDC
- Get started with the RMON API
- Backup and recovery
- How to use groups and roles
- How to change user settings
Servers
Client checks in RMON 2.0
Client checks show whether real application operations succeed, how long they take and what changes between releases. Your browser, desktop application, mobile app or background job measures an operation and sends its result to RMON. RMON 2.0 turns those observations into reports, comparisons and notifications.
A website can return HTTP 200 while customers wait ten seconds for their catalogue. A desktop importer can reach every server and still reject half a file. Client checks let you measure the part the person actually cares about: “Did my operation finish, and was it fast enough?”
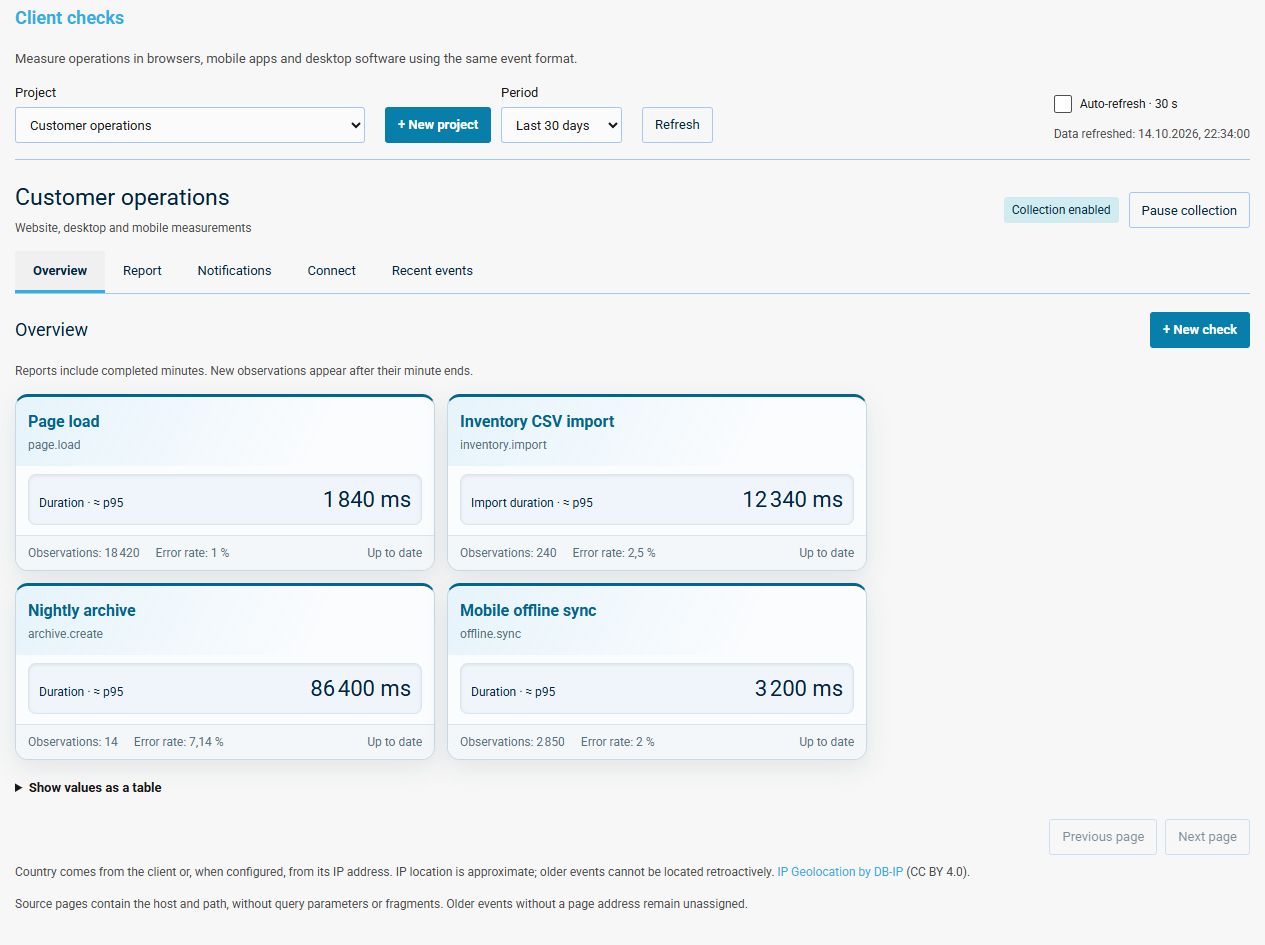
This guide takes a local CSV import from a check definition to a report and an alert. The same workflow applies to browser and mobile measurements. Screenshots show the RMON 2.0 interface with demonstration data; the numbers are examples, not performance benchmarks.
What can you monitor with Client checks?
Start with an operation that has a useful result, a measurable cost or both. It does not have to make an HTTP request. Reading a file, generating a document and processing an offline queue can all produce observations.
Scroll horizontally to view the full table.
| Operation | Useful measurements | Question it answers |
|---|---|---|
| Load a page or catalogue | Load time, server wait, transferred bytes; country, page and app version | Are customers in a particular region waiting longer, even though the site is available? |
| Import a CSV file in desktop software | Duration, rows processed, rows rejected; application version | Did the latest release make imports slower or less reliable? |
| Synchronize a mobile app | Duration, items synchronized, outcome; platform and network type | Does synchronization fail more often on mobile data than on Wi-Fi? |
| Create and verify an archive | Duration, files archived, archive size, outcome | Did the job produce a usable archive, and is its runtime growing? |
| Generate a PDF or process an image | Duration, output size, outcome; document type or processing mode | Which kind of work is slow, and did an optimization help? |
Your integration collects these values and decides what success means. For an archive, that might include checking the output after writing it. For an import, it might mean that every required row passed validation. RMON receives the result; it does not run your CSV parser or verify the archive for you.
Why use this alongside uptime monitoring?
HTTP checks and other agent checks make scheduled observations from your chosen locations. Client checks add measurements from the applications doing real work. Together, they help distinguish an unavailable service from an available service with a slow or failing user operation.
- Measure the result that matters. Track a completed import or synchronization, including work performed entirely on a device.
- Narrow down a regression. Compare the same operation by application version, platform, country or a declared context field.
- Turn measurements into action. Notify on a sustained rise in duration or error rate, with enough samples to make the signal useful.
- Keep collection under your control. Send measurements to your own RMON receiver and choose which metrics and context leave the application.
A Client check does not require a RMON agent on each customer device. It does require integration code in the application. It is also not a heartbeat: an application that never starts, or a page that fails before its measurement code runs, cannot send an observation. Keep scheduled availability checks for those situations.
1. Create a project and define an operation
You need RMON 2.0, permission to edit Client checks, and a receiver reachable from your applications. The receiver must support the Client projects role. Use HTTPS for public clients. If the receiver is not configured yet, follow the RMON Server guide and review the network requirements.
- Open Client checks and choose New project. Give it a recognizable name, such as
Customer operations. - On Overview, choose New check and leave Check template set to Custom check. Enter
Inventory CSV importas the name andinventory.importas the code. - Enable Record success or failure and Measure duration in milliseconds. Name the duration
Import duration. - Add the two custom metrics below and choose the duration as the Primary metric. Save the check.
For a quicker start with common measurements, the check editor also offers templates for Page load, HTTP response, JavaScript errors and Operation duration. They fill in the definition and provide matching measurement code in Connect. Page-load and JavaScript-error collection run in the browser; HTTP-response and operation examples also support .NET and Android. A custom check is useful here because the importer needs its own row counters.
Scroll horizontally to view the full table.
| Code | Display name | Type and unit | Settings |
|---|---|---|---|
rows_processed | Rows processed | Integer, rows | Required; minimum 0 |
rows_rejected | Rows rejected | Integer, rows | Required; minimum 0 |
Metric bounds validate incoming data. They are not alert thresholds. Leave the maximum blank unless a larger value is invalid: a slow import is still a measurement worth receiving. Configure “too slow” separately under Notifications.
Use environment, platform and app_version to identify production desktop observations and the release that produced them. These context fields are available by default, along with country and network type. You can declare custom context, such as an import mode; up to two custom fields can be enabled for filtering and grouping.
Keep the check code stable across releases. Use Edit name and description for display changes and New definition version when measured fields change. Existing clients can continue sending their earlier definition version. A field's type and unit, and whether a check records an outcome, cannot change under the same code.
2. Connect your application
Choose where observations go
Open Connect, select the check, choose the project's Receiver addresses entry and save it. Confirm that Event endpoint is the HTTPS address your application can reach, ending in /api/v1/client/events. Changing the saved receiver updates new integration examples; update already deployed applications separately.
Issue a sending key with the right scope
Choose Issue key, give it a useful name such as Desktop importer — production, select inventory.import and allow the production environment. Keep Allow applications without an Origin header enabled for native applications and scripts.
For a browser integration, add the exact website origin, for example https://shop.example.com, without a path or trailing slash. Disable requests without an Origin header if the key is only for that browser integration. Separate keys make it easier to revoke or replace one integration without interrupting another.
Copy the key when it is issued: its full value is not shown again after leaving the project or reloading. A sending key can submit observations; it cannot read reports or administer RMON. Browser and distributed application code can be inspected, so use the available scope restrictions and keep administrative credentials out of clients.
Use the generated example, then supply real measurements
Select Custom measurements (example) as the measurement code, choose Windows / .NET and set Platform to desktop. Connect also provides Browser JavaScript, Android / Java, curl and an HTTP JSON body. The example uses the selected check and its current definition version. The .NET example targets .NET 8 or later.
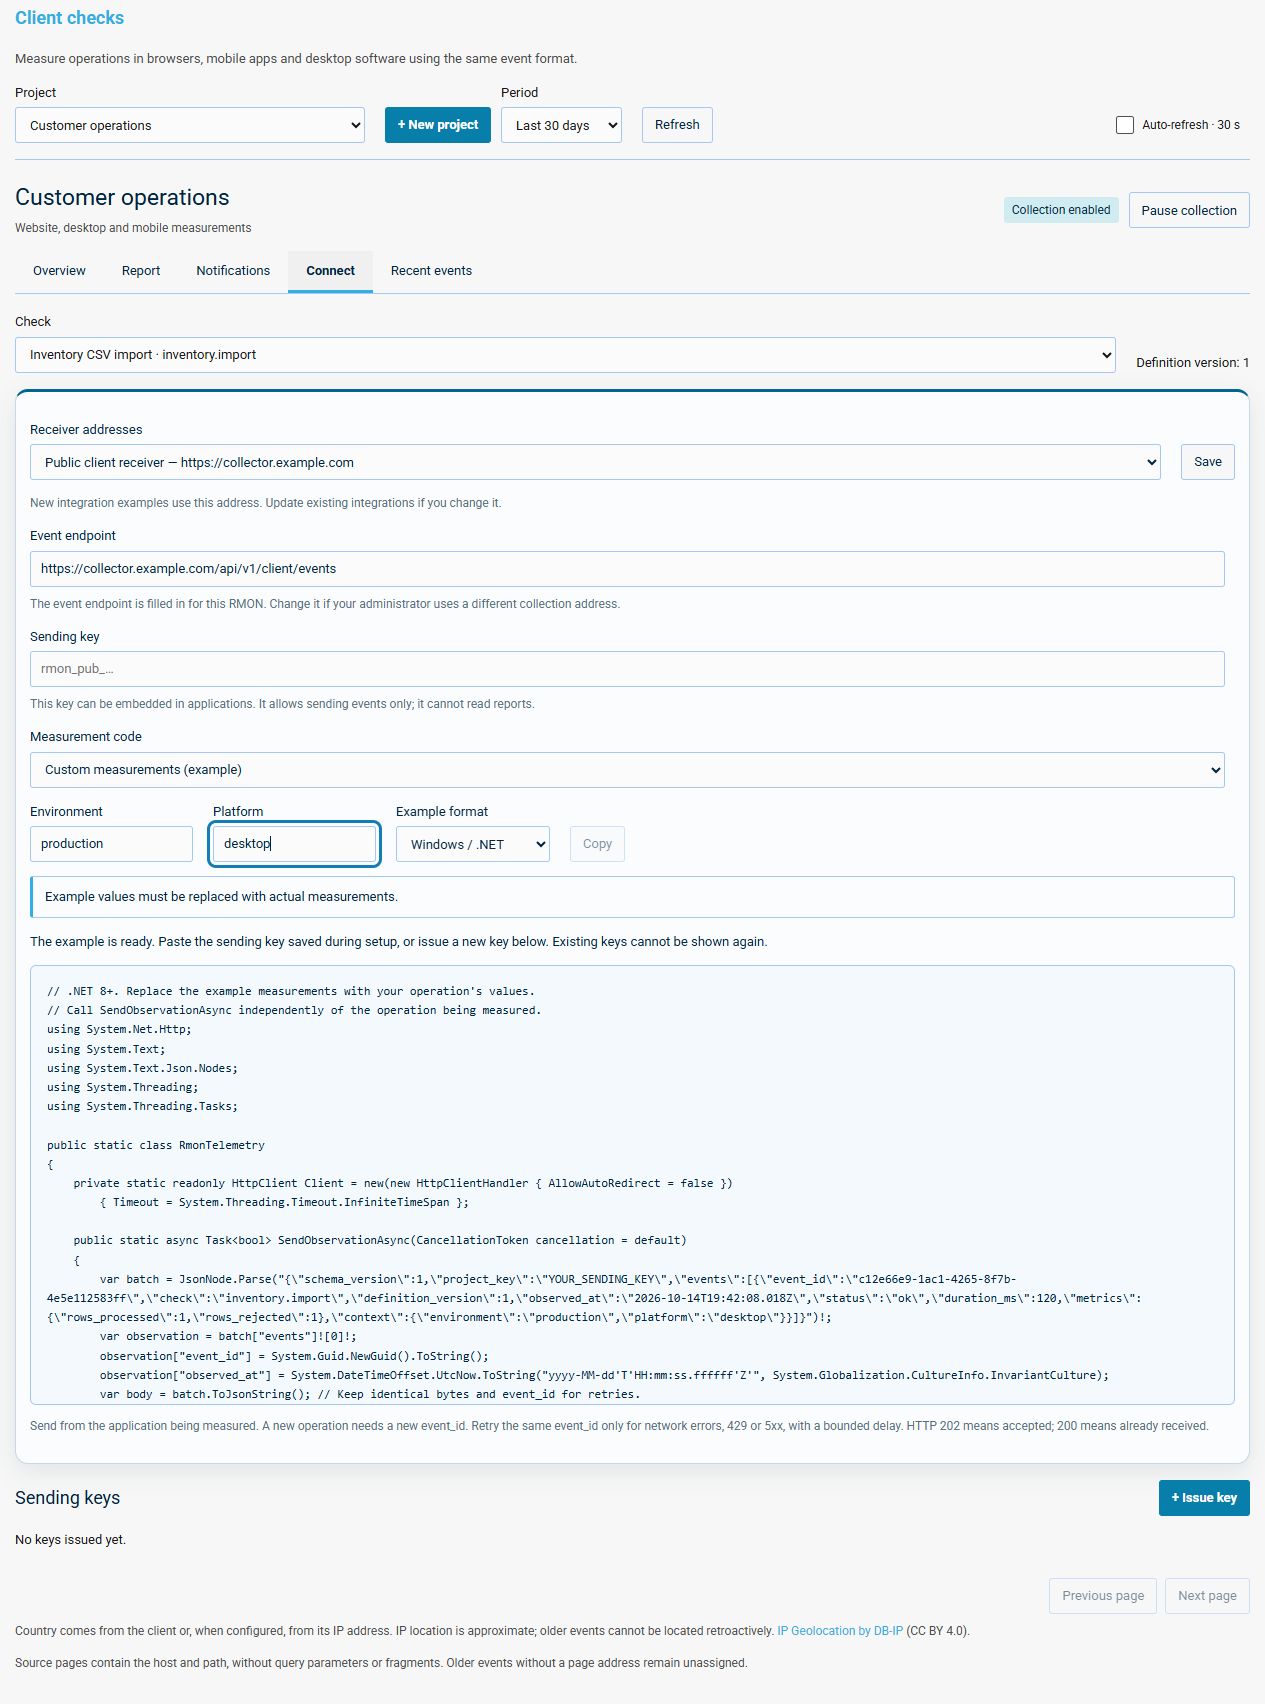
Instrument the operation in your application: start a timer before the import, stop it after validation, count processed and rejected rows, then send one observation. Keep telemetry delivery separate from the operation's success or failure. A receiver timeout should not turn a successfully imported file into a failed import.
For this example, define rows_processed as successfully imported rows, rows_rejected as rejected rows, and mark the operation as failed if any row is rejected. One illustrative event inside the generated batch would look like this:
{
  "event_id": "324f0c9d-7b44-4b89-9689-3f2a72974a20",
  "check": "inventory.import",
  "definition_version": 1,
  "observed_at": "2026-10-14T12:00:00Z",
  "status": "error",
  "duration_ms": 12340,
  "metrics": {"rows_processed": 24000, "rows_rejected": 1},
  "context": {
    "environment": "production",
    "platform": "desktop",
    "app_version": "4.2.0"
  },
  "error": {"code": "invalid_row", "message": "A required field was missing"}
}
This is an event illustration, not a complete request. Use the batch generated by Connect, including its sending key, and replace the example values with actual measurements. Generate a fresh UUID and current observation time for every new operation. Accepted observations must be within the last 24 hours and no more than five minutes in the future.
Retry the same observation with the same event ID and body after a network failure, HTTP 429 or a server error, using bounded delays. HTTP 202 means accepted; 200 means the observation was already received. Fix a rejected field or key scope instead of repeatedly sending an unchanged invalid request.
Send one known successful operation and one deliberate validation failure. Open Recent events to confirm receipt and inspect their values. Then check Report after the observation's minute has ended and processing has caught up. Seeing an event arrive and seeing it included in a completed report are separate steps.
3. Read the report and compare releases
Open Report, select inventory.import, choose a period and select Import duration. Use Filters to select environment = production and platform = desktop, then apply them. Set Compare by to App version.
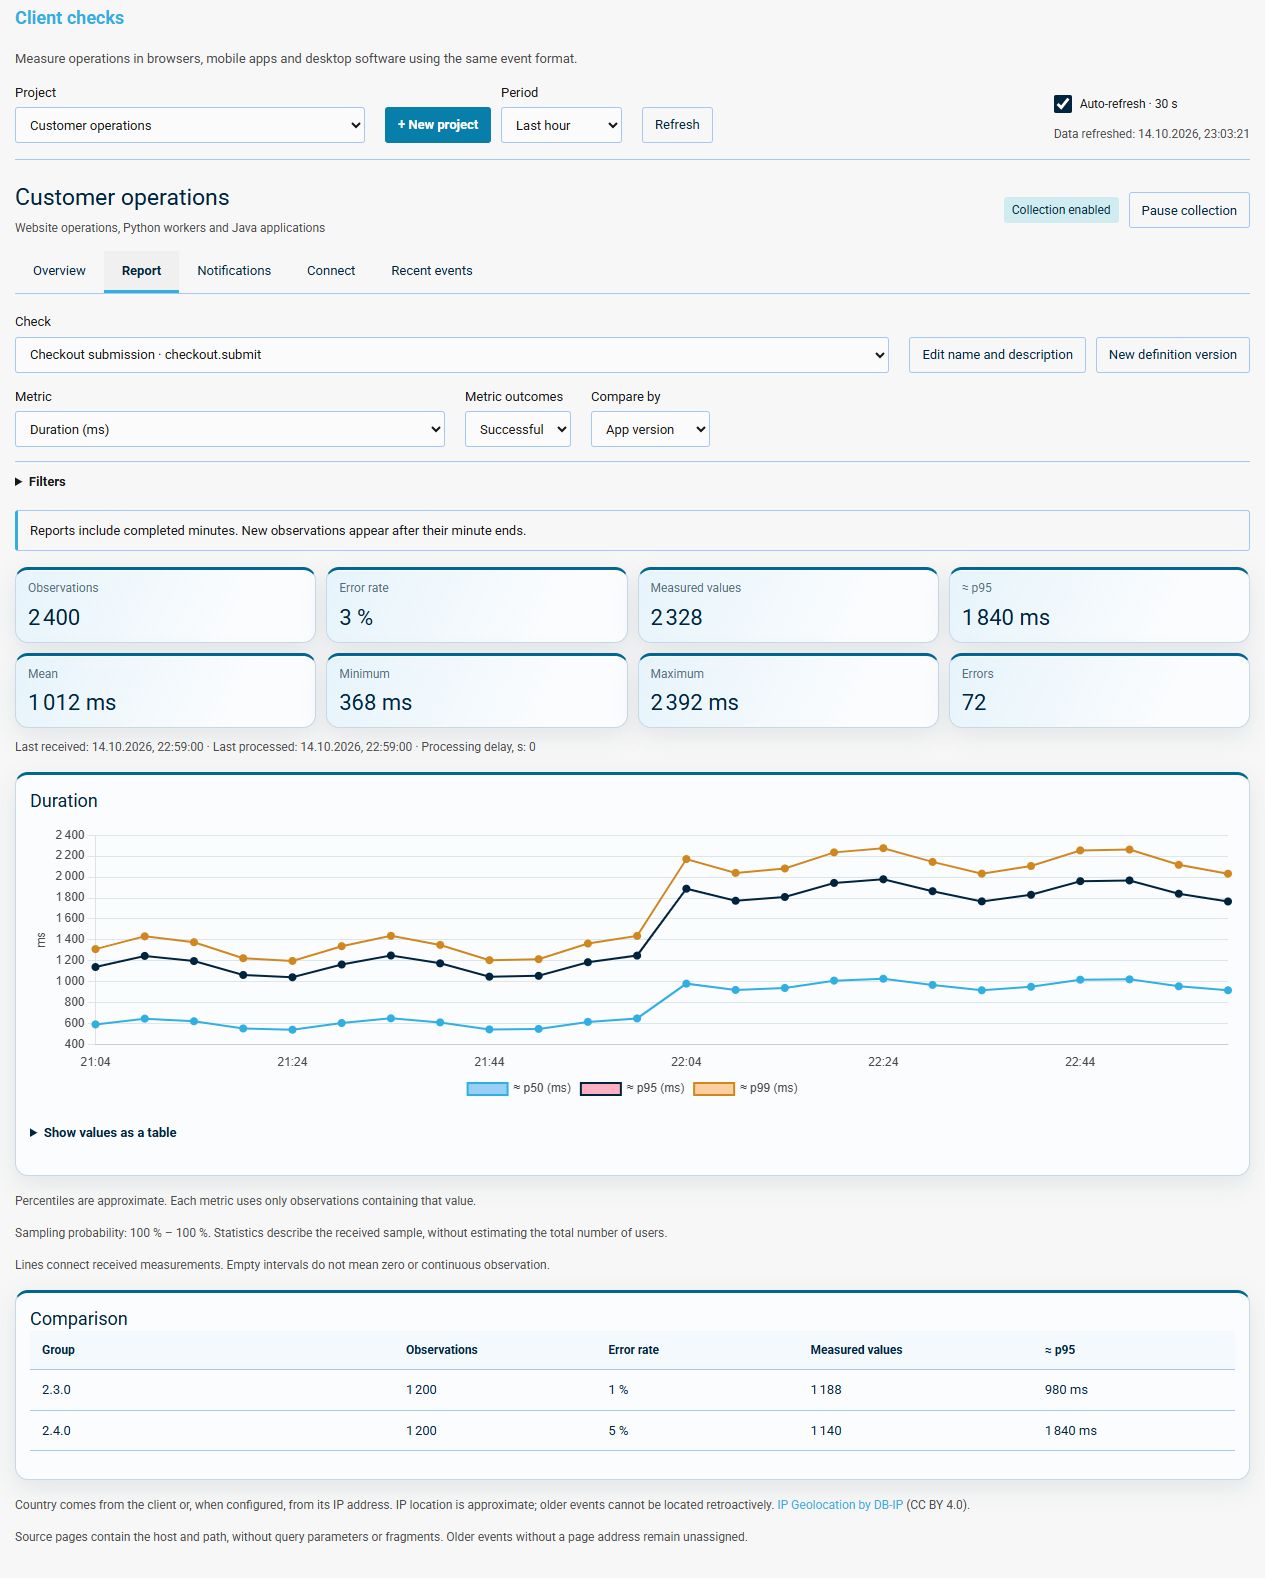
In this demonstration, version 4.2.0 has a higher approximate p95 import duration and error rate than 4.1.0. That gives you a release and an operation to investigate. It does not establish the cause: compare similar file sizes and import modes before blaming a code change.
- Observations counts received operations in the selected scope. Measured values counts observations contributing to the selected metric and outcome filter.
- Approximate p95 describes the slower end of the measured distribution: roughly 95% of measured values are at or below it. Use it alongside the mean, sample count and error rate.
- Metric outcomes lets you view successful, failed or all operations. Duration reports default to successful operations when the check has outcomes, so failed attempts do not silently mix into that timing view.
- Compare by separates countries, platforms, application versions, source pages or declared filterable context. Use a comparison to find a segment, then filter it for a closer look.
Switch the metric to Rows rejected and include all outcomes to inspect validation failures. For a browser check, compare source pages or countries; for mobile synchronization, compare network types. Choose context that helps answer a specific operational question.
Reports include completed minutes and may be incomplete while processing is pending. Missing measurements are not zeros, and a line between points does not prove continuous observation. Percentiles are approximate, and sampling statistics describe received observations rather than estimating all users.
Country comes from the client or configured IP geolocation and is approximate. Source-page addresses omit query parameters and fragments. Choose stable page paths, context values and diagnostic error codes: a filename, URL path or free-text error can still disclose more than the metric needs. Client checks work with the supported SQLite, PostgreSQL and MySQL installations; a separate database product is not required.
4. Notify on slow operations and errors
Once the measurements are useful, let RMON watch them for you. Create a notification channel in the project's group, then open Notifications, select the check and choose New rule.
For a busy importer, the following example asks RMON to open an incident when successful imports remain slow. These are starting values for this example; choose a window and sample count that fit your actual operation volume.
- Name the rule
Slow inventory importsand selectproduction. - Choose Import duration, statistic p95, successful outcomes, condition > and threshold
10000milliseconds. - Set the window to 60 minutes and require at least 10 measurements per window.
- Require two consecutive windows to open an incident and two healthy windows to resolve it. Allow two minutes for late data.
- Add any segment filters, select the delivery channels below the conditions and save the rule.
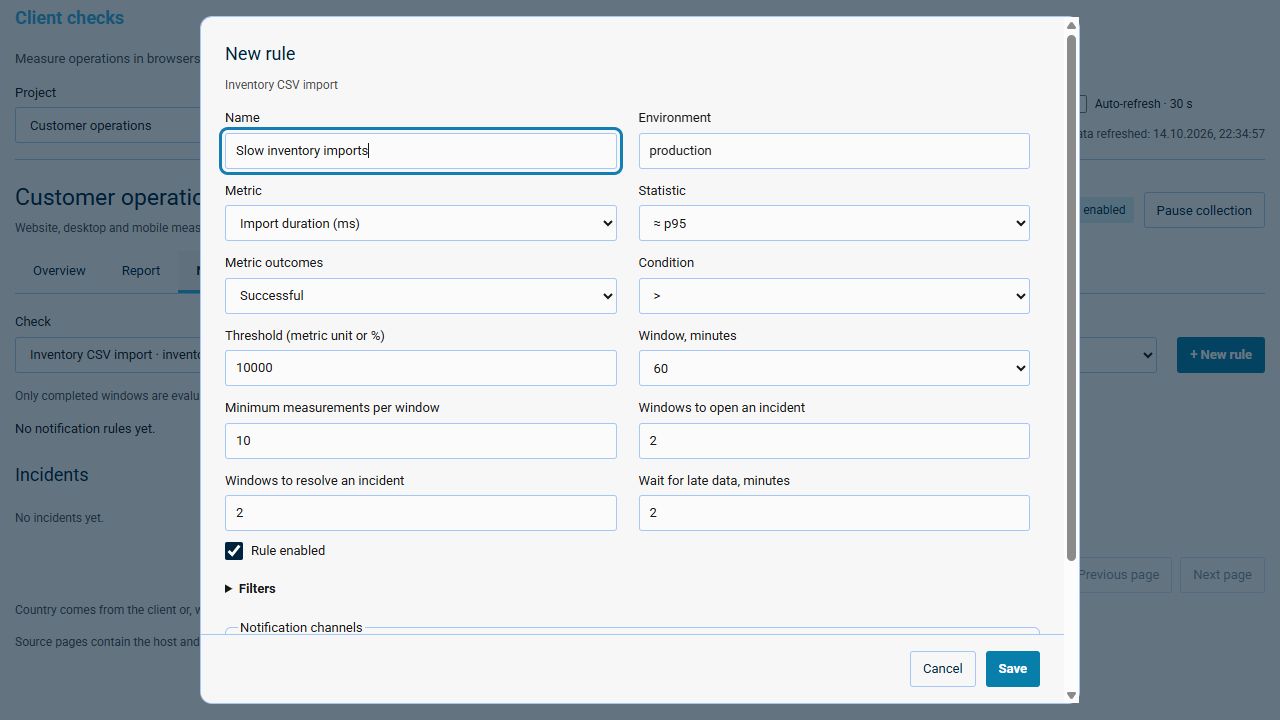
This detects a sustained slowdown rather than notifying about every slow import. A high-traffic website could instead use p95 page-load time above 2000 ms, five-minute windows and at least 100 measurements per window. For an error-rate rule, choose Error rate (%); the threshold is a percentage and the sample count uses observations that report an outcome.
Rules evaluate future completed windows after the configured delay. Missing data, too few samples or pending processing do not count as recovery and break the consecutive-window count. A nightly job will not satisfy a rule expecting ten measurements every hour; a missing job also does not automatically produce a failure event.
Late observations can update historical reports without reopening previously evaluated alert windows. After downtime, evaluation resumes with fresh windows rather than sending historical incidents. Incident history shows opening, recovery and delivery status. Failed deliveries retry automatically, up to ten attempts; use Retry failed deliveries after correcting a channel problem. Recovery delivery follows the opening notification for that recipient, and an uncertain network response can cause a duplicate message.
Pause rule stops evaluation without closing its incident or cancelling queued messages. While an incident is open, its conditions and recipients stay fixed. Resume evaluation and allow healthy windows to resolve it before changing those settings.
If the first observation does not appear
Scroll horizontally to view the full table.
| What you see | What to check |
|---|---|
| No event in Recent events | Confirm that the application executed the measurement code. Check the receiver URL, HTTPS connectivity, collection state and the response to the send request. |
| A request is rejected | Check key scope, exact browser origin or native-client permission, environment, check code and definition version. Verify required fields, metric types and the device clock. |
| The event arrived but the report is empty | Wait for its minute to complete. Check processing status, period, context filters and Metric outcomes. A failed import will not contribute to a successful-only duration view. |
| A country or source-page group is missing | Supply country or configure geolocation; include a relevant page address for browser observations. Older events without that information are not filled in retroactively. |
| A rule does not open an incident | Check the selected environment, filters, enabled state, completed windows, processing delay, minimum measurements and required consecutive breaches. |
| An incident exists but a message is missing | Inspect delivery status and the selected channel configuration. Correct the destination, then retry failed deliveries. |
Update and recover
Follow the backup and recovery guide and update guide. Preserve the database, configuration, encryption key and certificates. Stop processes using the database during migrations, then start matching RMON and RMON Server versions.
After an update, verify an existing agent check, a newly received client observation and its report. If you need to roll back, restore the previous application version together with its pre-upgrade database and configuration; changing the application image alone does not reverse a database migration.
For more background and examples, read Client checks: monitoring from the user's side.